
I’ve been looking to sell my car and struggled to decide on a fair selling price. I decided to scrape some data from Autotrader and analyse the prices of similarly spec’d cars to build a valuation model. The project quite successful with good agreement between the model’s price estimate, and existing online valuation tools.
Summary
- Wrote a web scraper to extract 1000 adverts for Audi A6’s.
- Engineered 11 features including age, mileage, fsh, quattro, engine size etc.
- My tuned Support Vector Regression model achieved R^2=0.97 and MAE=£961.
- The features which influenced pricing most were Age and Mileage.
- The model valued my car at £9,838. Which is within £200 of Autotrader’s own “recommended selling price”.
Libraries: Pandas, NumPy, Requests, BeautifulSoup4, Matplotlib, Seaborn Scikit-learn,
Data exploration
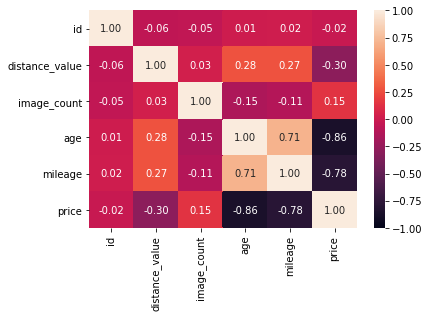
In terms of numerical features, both age and mileage were very strongly correlated with the target variable price. These were the only 2 numerical parameters used in my analysis, everything else was engineered or binned into categorical features.
I used regex to extract categorical featurrs from the advert text etc.
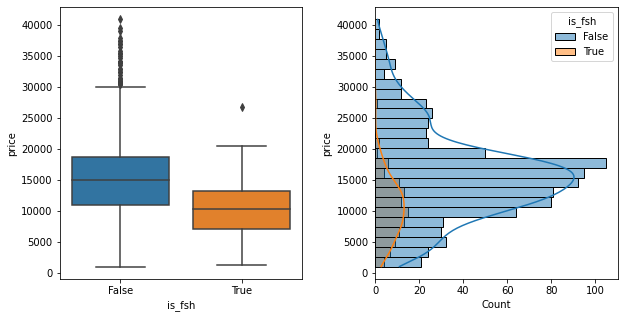
Some sellers choose to highlight when a car has full service history (or FSH). Note: I did not search text within each advert’s detail page, only the search page summary, so this feature was only true when the seller chose to highlight the service history in the attention grabber text.
Generally we’d expect this be appealing to buyers and increase the value… however adverts with FSH mentioned turned out to be typically lower value than the ones which didn’t mention it which was surprising…
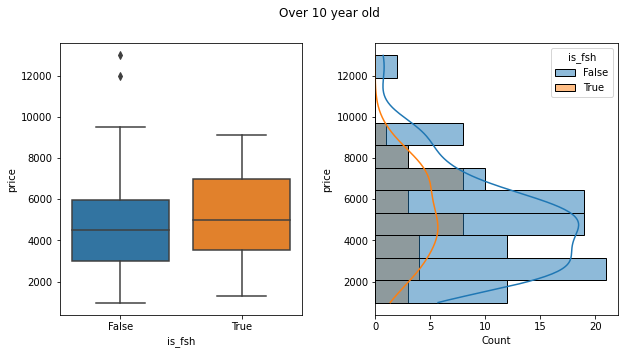
…On closer inspection fsh only tended to be mentioned on older cars. So filtering the data down to those over 10 years old showed that the presence of “fsh” in the advert did tend to correlate with higher prices, but only on older cars.
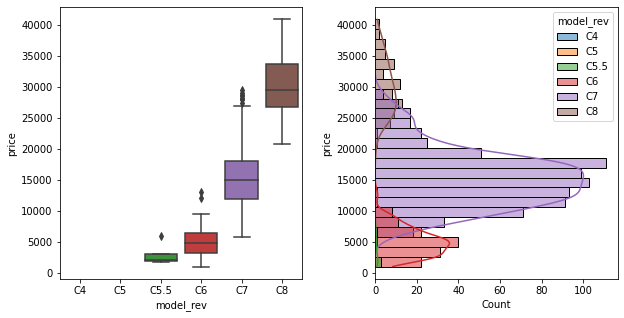
Model revision was calculated by binning the registration dates according to some dates from Wikipedia. This is therefore just a low fidelity abstraction of the age feature, but I thought it was valuable to include so the model could pick up any “step” in pricing between consecutive model revisions. There wasn’t much overlap in pricing between these categories (except in the much older model revisions) which made sense.
 (note to self)…should insert scatter plot coloured according to model_rev classes
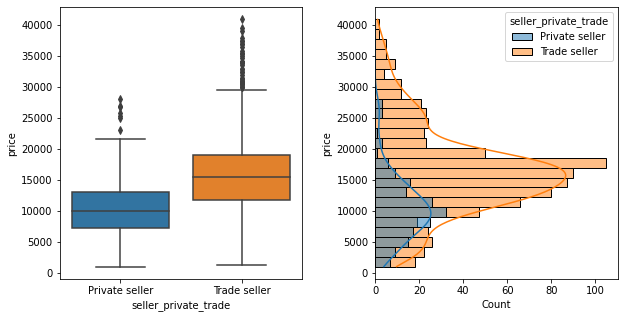
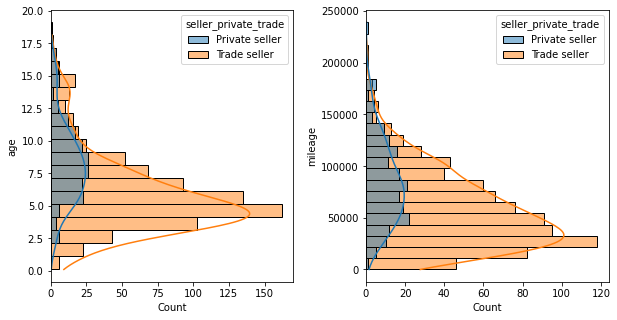
Privately sold cars were generally lower value than from trade sellers… however privately sold cars were also typically older and higher mileage than from trade sellers. So there’s some feature interactions behind this which aren’t apparent from just looking at this one feature. 2nd row of plots provided below to show the distribution of age/mileage whether “private” or “trade” seller.
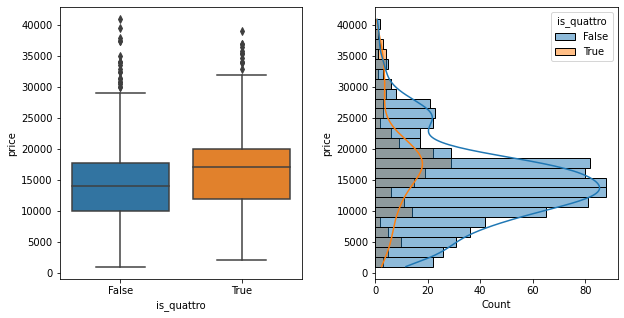
Adverts which mentioned “quattro” were slightly higher value. Quattro is a feature that has been available on most modelyears of Audi A6, so this should apply across all ages of car.
Modelling results
I trained the following “Simple” regression models using only 2 input features (age, mileage) with default hyperparams:
- Linear Regression
- Elastic-Net tried with L1 and L2 regularisation
- K-nearest neighbours (KNN)
- Suport Vector Machine (SVM)
- Decision Tree (Tree)
- Random Forest (Forest)
Almost all models provided reasonable r^2 and Mean Absolute Error (MAE) scores with default hyperparameters, except the SVR model which only produced acceptable results after gridsearch tuning of hyperparams. Without further tuning any of the other “simple” models, SVR was the model with lowest errors MAE=1623 and MSE=4.5e6, and highest r^2 score of 0.91.
I then trained a “Complex” variant of each model, including all the generated input features (age, mileage, engine_size, seller_private_tradd, model_rev, is_fsh, is_tdi, is_quattro, is_black_edition, is_ultra, is_s_line)
This resulted in a reasonable improvement in model fitting accuracy while still generalising well on the testing set and cross validation. The best fitting model was again the SVR model using the same hyperparams as before, achieving error of MAE=961, MSE=1.8e6 and r^2 score of 0.97. Clearly the additional input features gave enough degrees of freedom to make a good fit to the data.
The model results look like they would generalise well, but further tuning and ensembling may be ways to improve the accuracy. There will always be some variability in selling price anyway, based on the local market, exact vehicle condition etc.
Inspecting the model
It was not trivial to visually inspect the multiple-regression model due to it’s high dimensionality. Since we know there were 2 variables which were strongly correlated with the target variable (age and mileage), all input features except these were held constant at their median or most-frequent values. The below plots show how the model predicted price against age or mileage while holding the other input constant at 0/25/50/75/100% quartiles in order to show the full response surface of the model.
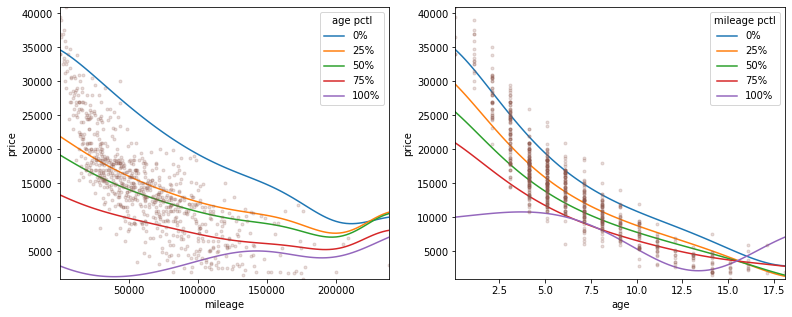
The predicted response over these continuous inputs was smooth which bodes well for generalisability. This is in contrast with the next best model, which was a Random Forest Regressor. Here the predicted response was less uniform and smooth. This is due to the orthogonal decision boundaries that random forest works with and could be smoother by adjusting hyperparameters such as how deep each tree in the forest is allowed to be.
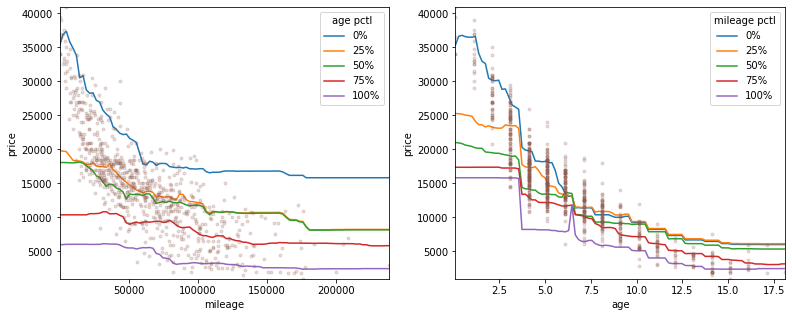
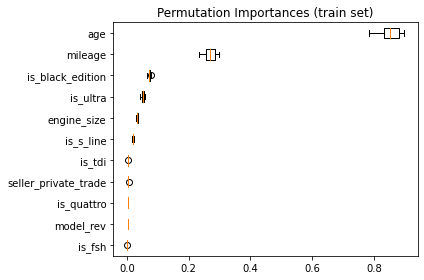
In both models, by looking at the spread of the quartile lines it is clear that age is predicted to be a more important feature, with stronger model weighting compared to mileage. The permutation feature importance is plotted below, confirming this. It also shows that of the binary features, the presence of “black edition” and “ultra” in the advert text were the biggest influences on price, followed by “engine_size” as the most significant categorical feature.
Model comparison table (simple model)
| name | cv_mean | cv_std | mae_test | mse_test | r2_test | |
|---|---|---|---|---|---|---|
| 0 | Linreg basic | 0.802644 | 0.0124396 | 2245.16 | 9.48089e+06 | 0.812901 |
| 1 | Linreg with poly features | 0.878056 | 0.00745929 | 1736.65 | 5.41615e+06 | 0.893116 |
| 2 | Elastic-net | 0.808763 | 0.0294758 | 2426.46 | 8.93401e+06 | 0.823693 |
| 3 | KNN | 0.890029 | 0.0154029 | 1729.91 | 4.78117e+06 | 0.905647 |
| 4 | SVR | 0.00689301 | 0.0048019 | 5346.68 | 5.05368e+07 | 0.00268901 |
| 5 | SVR tuned | 0.896578 | 0.00670467 | 1622.79 | 4.52914e+06 | 0.91062 |
| 6 | Tree | 0.863705 | 0.0176042 | 1863.78 | 5.67888e+06 | 0.887931 |
| 7 | Forest | 0.865559 | 0.0174099 | 1866.68 | 5.68772e+06 | 0.887756 |
Model comparison table (complex model)
| name | cv_mean | cv_std | mae_test | mse_test | r2_test | |
|---|---|---|---|---|---|---|
| 0 | Linreg complex | 0.923708 | 0.0113085 | 1280.97 | 2.83365e+06 | 0.94408 |
| 1 | Linreg complex + poly features | 0.94751 | 0.00473454 | 1159.01 | 2.20182e+06 | 0.956548 |
| 2 | KNN complex + poly | 0.951666 | 0.00797216 | 1076.34 | 2.25113e+06 | 0.955575 |
| 3 | SVR complex | 0.960544 | 0.00256924 | 961.39 | 1.75286e+06 | 0.965408 |
| 4 | Tree complex | 0.916312 | 0.0210107 | 1427.26 | 3.79339e+06 | 0.92514 |
| 5 | Forest complex | 0.954217 | 0.00429592 | 1048.90 | 1.87811e+06 | 0.962937 |
Future work
- I could make this into a web app to deploy the code online and offer users a streamlined way to make selling price suggestions for their own car.
- At the moment this model only works for an Audi A6, the approach could be made less brand specific by eliminating features like
is_quattrooris_s_lineetc, and by scraping data across other brands/models. - Additional features could be extracted by also scraping from each advert’s detail page, though this data appeared to be behind JavaScript dynamic page elements and may require an alternative web-scraping approach.
- Potentially could try license plate recognition and then look to bring in data from DVLA (if possible to extract more data about mot history etc, but that is a big project when even my simple models are producing accurate predictions).